

Monitor
Every execution the chat triggered, synchronous or asynchronous, with its status, duration, payload, and live event stream.
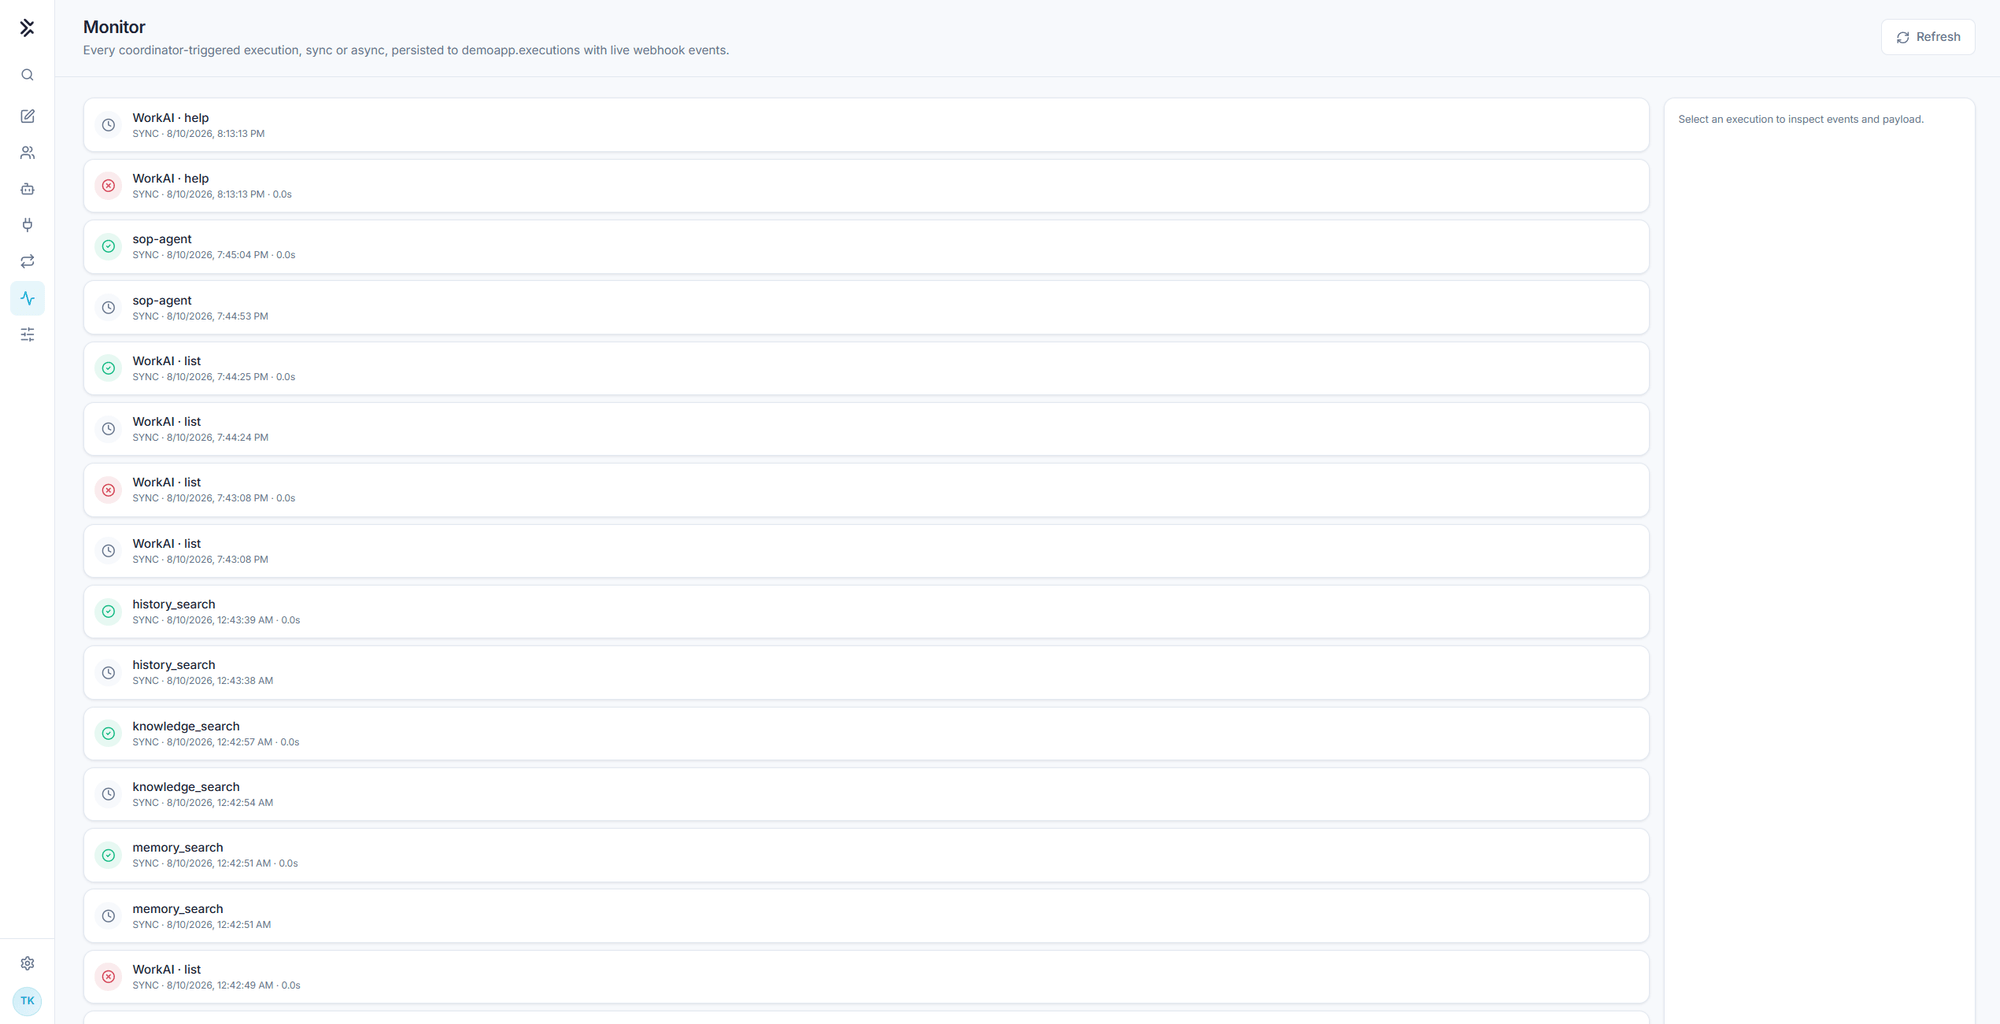
Monitor is the record of what the chat actually caused to happen. Every coordinator-triggered execution lands here, synchronous or asynchronous, with its payload and a live stream of the events reported back.
What lands here
More than you might expect. Monitor is not only an agent log, it is the execution log for everything the coordinator triggers:
- Calls to registered agents, webhook and A2A alike
- Calls to tools on connected MCP servers, shown as
Server · tool - Built-in tool calls such as
knowledge_search,history_search, andmemory_search - Routine runs, whether triggered on schedule or by hand
- Long-running asynchronous work that reports progress by webhook after the chat turn has ended
That breadth is what makes the page useful for a question the transcript cannot answer: not "what did Flux say it did", but "what actually ran, in what order, and how long did it take".
Reading the list
| Column | What it shows |
|---|---|
| Name | The tool, agent, or routine that ran |
| Sync or Async | Whether it returned into the turn or reported back later |
| Timestamp | When it started |
| Duration | How long it took |
| Status icon | Pending, completed, or failed |
Select any execution to inspect its events and payload in the panel on the right. Refresh re-reads the list.
| Status | Meaning |
|---|---|
| In progress | Still running |
| Completed | Finished successfully |
| Failed | Ended with an error |
Asynchronous executions are the reason this page exists. A synchronous call returns into the conversation and you read the result there. Work that continues after the turn ends has nowhere else to report, so its events land here as they arrive.
Getting here from a tool call
Every tool card in a transcript carries a Monitor link. Use it rather than scanning the list: it takes you straight to the execution behind that specific call, which is usually the one you want when an answer looked wrong.
Reading it during an investigation
Three patterns worth knowing.
A failed call the answer glossed over. A run can produce a confident answer after a tool failed, because the model worked around it. A red status in Monitor tells you the answer was built on less than you assumed.
A repeated call. The same tool appearing several times in quick succession usually means the coordinator did not get what it needed the first time. Worth checking whether the tool description or the server's catalog is misleading it.
A long duration on a fast tool. Points at the far side, not the chat. Compare the payload with what that system normally accepts.
Monitor, or workflow tracing?
Different observability surfaces, for different things:
| Question | Where |
|---|---|
| What did this chat trigger, and what came back? | Monitor |
| What did a workflow run do, node by node? | Execution traces |
| Is a workflow healthy over time? | Monitoring and observability |
| What has my co-worker been doing? | The History store in Co-Worker Studio |
When an agent or routine misbehaves, check Monitor before rereading the transcript. The transcript shows what Flux said it did; Monitor shows the payload that actually went out and the events that came back.
Routines & Watchers
Saved playbooks that run on a schedule, a webhook, or a channel message, deliver their own result, and can pause for your approval.
Configuration
Choose the models the chat uses, set gateway credentials for FlowGenX agent calls, share configuration values with your automations, and mint API keys for headless callers.