

Charts, Docs & Decks
Artifacts are the real output of a chat. Render them in the panel, switch between visual and source, export to PowerPoint or PDF, and publish one to a link.
An artifact is a file the conversation produced: a chart, a dataset, a document, a slide deck, a generated app, or a link to something published. Artifacts open in the right-hand panel, persist with the conversation, and can be refined by asking.
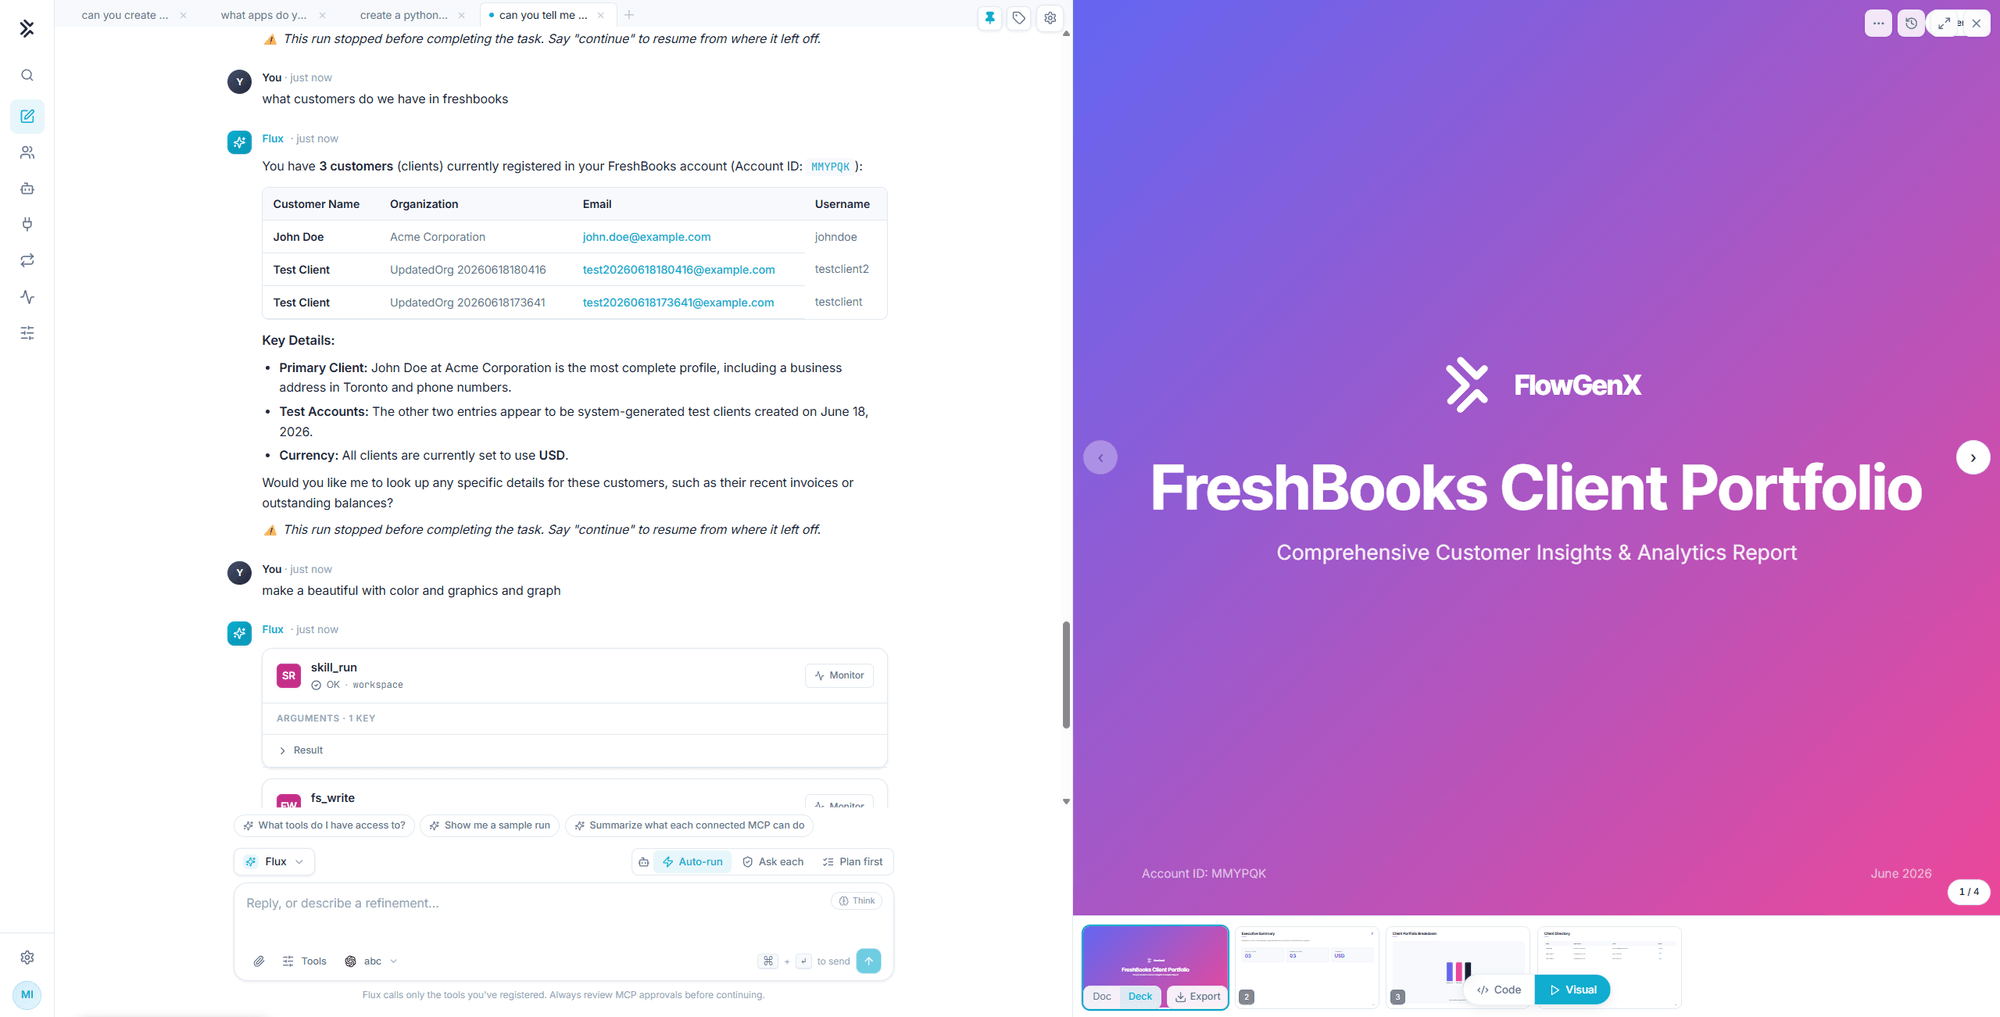
That deck came from a follow-up in plain language: "make a beautiful with color and graphics and graph". The table stayed in the transcript, the deck opened in the panel.
Kinds of artifact
| Kind | What it holds | Rendered as |
|---|---|---|
| Chart | A plotted series | An interactive chart |
| Code | A generated file or app | Live preview, with a source view |
| Data | A structured result | A readable render, with a source tree |
| Media | An image, video, or audio file | An inline player or viewer |
| URL | Something hosted elsewhere | An embedded view with a link out |
Visual and source
Code and data artifacts carry two faces, toggled at the bottom of the panel:
- Visual. The rendered result: the running app, the formatted document, the chart.
- Code. The source behind it.
For generated apps a Console strip sits along the bottom for logs and errors. See Dashboard apps.
Code artifacts also keep a version history, so a refinement that made things worse is recoverable rather than a reason to start the conversation again.
Documents and decks
When Flux produces an HTML document, the panel offers two readings of the same artifact:
- Doc. One continuous page.
- Deck. A slideshow with arrow-key navigation, a thumbnail strip, fullscreen, and speaker notes.
The toggle is non-destructive. A report written as a document can be presented as slides without regenerating it.
Exporting
The Export menu adapts to what is open.
| Open as | Export options |
|---|---|
| Deck | PowerPoint (.pptx), PDF (print), Slides as PNG (.zip), Download .html |
| Doc | PNG image, Copy image, PDF (print), Download .html |
| Anything else | Download .html |
PDF export goes through the browser's print dialog, so allow popups for the site or the export will be blocked.
Charts
Charts render as first-class artifacts with their own entry in the panel, not as static images in the reply. Ask for a different cut, a different chart type, or a different series and Flux updates it.
Diagrams written as Mermaid render inline in the transcript, which is usually the faster choice for a flow or a sequence you only need to look at once.
Publishing an artifact to a link
Publish turns an artifact into a standalone full-page URL at /a/<slug>, with no chat chrome around it. Three visibility settings:
| Visibility | Who can open it |
|---|---|
| Public | Anyone with the link |
| Private | Only you, signed in |
| Locked | Anyone with the link and the password |
A publication is a snapshot. Code artifacts publish their source, which the page renders live; data artifacts publish the render captured at publish time. Continuing to refine the artifact in chat does not update the published page. Publish again to update it.
Publishing is the natural end of a dashboard request: build it in the conversation, check it in the panel, then hand out a link instead of a screenshot.
Working in a Chat
Run modes, tool scoping, attachments, extended thinking, and how to resume a long task. The controls that decide how much rope Flux gets.
Dashboard Apps
Ask for a dashboard and get a running React app in the panel, with charts, tabs, a source view and a console. Point it at a routine to keep it live, then publish it to a link.