

Dashboard Apps
Ask for a dashboard and get a running React app in the panel, with charts, tabs, a source view and a console. Point it at a routine to keep it live, then publish it to a link.
Ask FlowGenX Chat for a dashboard and it does not return a picture of one. It writes a React application, runs it in the artifact panel, and lets you refine it in conversation.
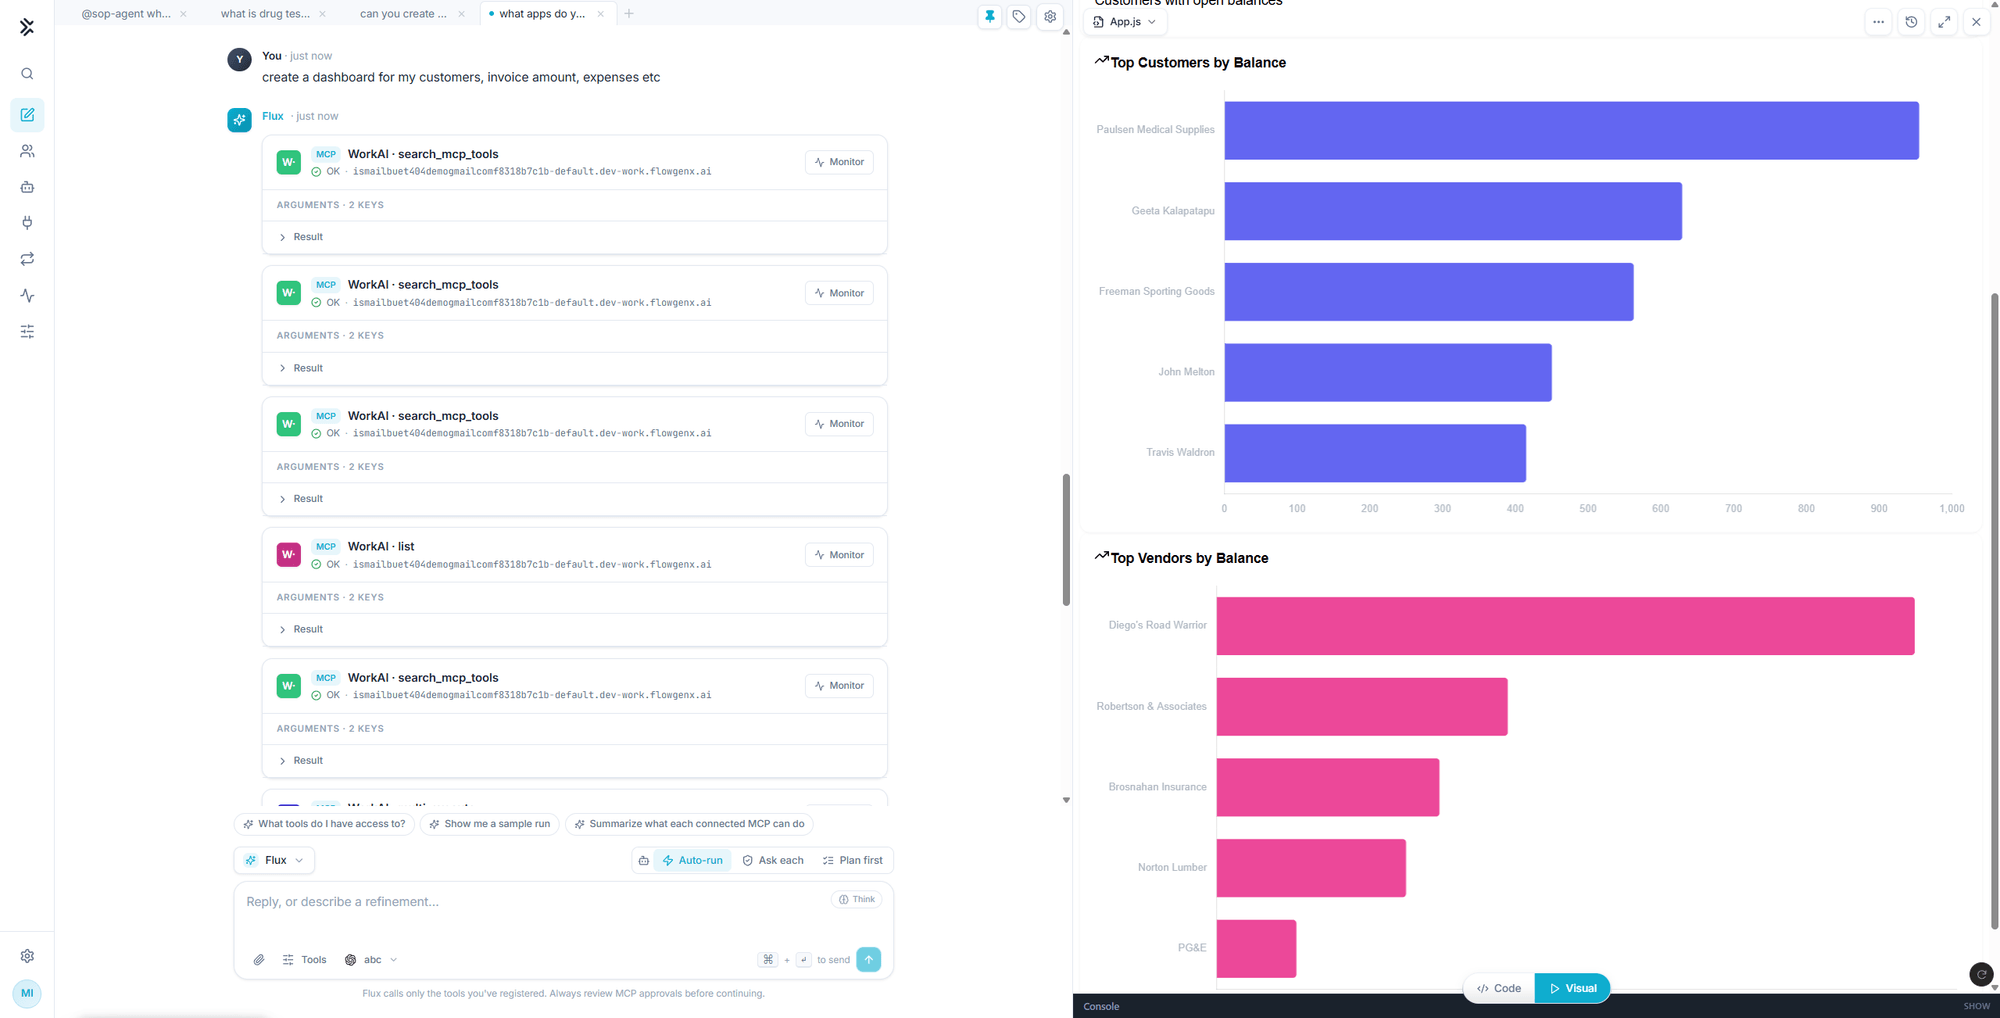
Asking for one
Name the source and the questions the dashboard should answer. Both of these produced the dashboards in this section:
can you create a dashboard from my salesforce customer?create a dashboard for my customers, invoice amount, expenses etcFlux pulls the data through whatever is connected, usually an MCP server or a registered agent, then generates the app around what it actually found.
Tip. Ask for the metrics, not the layout. "Total pipeline, won amount, and accounts by industry" gives it something to build; "make it look professional" does not. Layout refinements are cheap afterwards, and they land as a new version rather than a rewrite.
What the app can use
Generated dashboards are bundled in the browser with a fixed set of libraries available, so there is no install step and no host configuration:
| Library | For |
|---|---|
chart.js and react-chartjs-2 | Charts |
recharts | Charts |
lucide-react | Icons |
clsx and tailwind-merge | Class composition for the built-in component styles |
Multi-view dashboards are normal. The Salesforce example carries Accounts and Opportunities as tabs inside the app itself.
Working on it
| Control | What it does |
|---|---|
| Visual | The running app |
| Code | The source, file by file |
| Console | Logs and errors from the running app |
| History | Earlier versions of the app, restorable |
| Refresh | Re-runs the app |
| Expand | Takes the panel full width |
The console is the one to reach for when a dashboard renders blank or a chart is empty. It usually names the problem directly, and pasting the error back into the chat is enough for Flux to fix it.
Keeping a dashboard live
A static dashboard is a snapshot of the moment you asked. To keep one current, pair it with a routine.
A routine that gathers data can expose its result at a tokened data endpoint, and a generated dashboard can fetch that endpoint at runtime. The routine reruns on its schedule, the dashboard reads the fresh result, and nobody regenerates anything.
This is the difference between "a dashboard of last Tuesday's pipeline" and "the pipeline dashboard".
Publishing
When the dashboard is right, Publish gives it a standalone URL at /a/<slug> with no chat chrome, set to public, private, or password-locked. Publishing a code artifact publishes its source, which the page then renders live.
Publication is a snapshot of the code, so refine first and publish after. Publishing again updates the same link. See Charts, docs and decks.
A public link is public. A dashboard built over customer records, invoices, or pipeline should be private or locked unless you have decided otherwise, and that decision should be made before you paste the link into a channel.
Charts, Docs & Decks
Artifacts are the real output of a chat. Render them in the panel, switch between visual and source, export to PowerPoint or PDF, and publish one to a link.
Knowledge Search
Semantic search across your organization's ingested documents, answered with ranked source matches and the exact passage highlighted on the original page.