

MCP Playground
Test and debug MCP servers, tools, and AI agents in an interactive environment
The MCP Playground is an interactive testing environment where you can test MCP servers, execute tools, chat with AI agents, and debug your agentic workflows—all in real-time before deploying to production.
Interactive Testing Environment
What is the MCP Playground?
The MCP Playground provides three testing modes:
MCP Tool Testing
Agent Chat Interface
Workflow Testing
Accessing the Playground
From MCP Server Management
1
Navigate to MCP Servers
From Agent Builder
2
Open Agent Playground
From Workflow Editor
3
Test Workflow in Playground
Playground Interface Overview
The Playground interface is divided into three main sections:
Main Interface Components
1
2
3
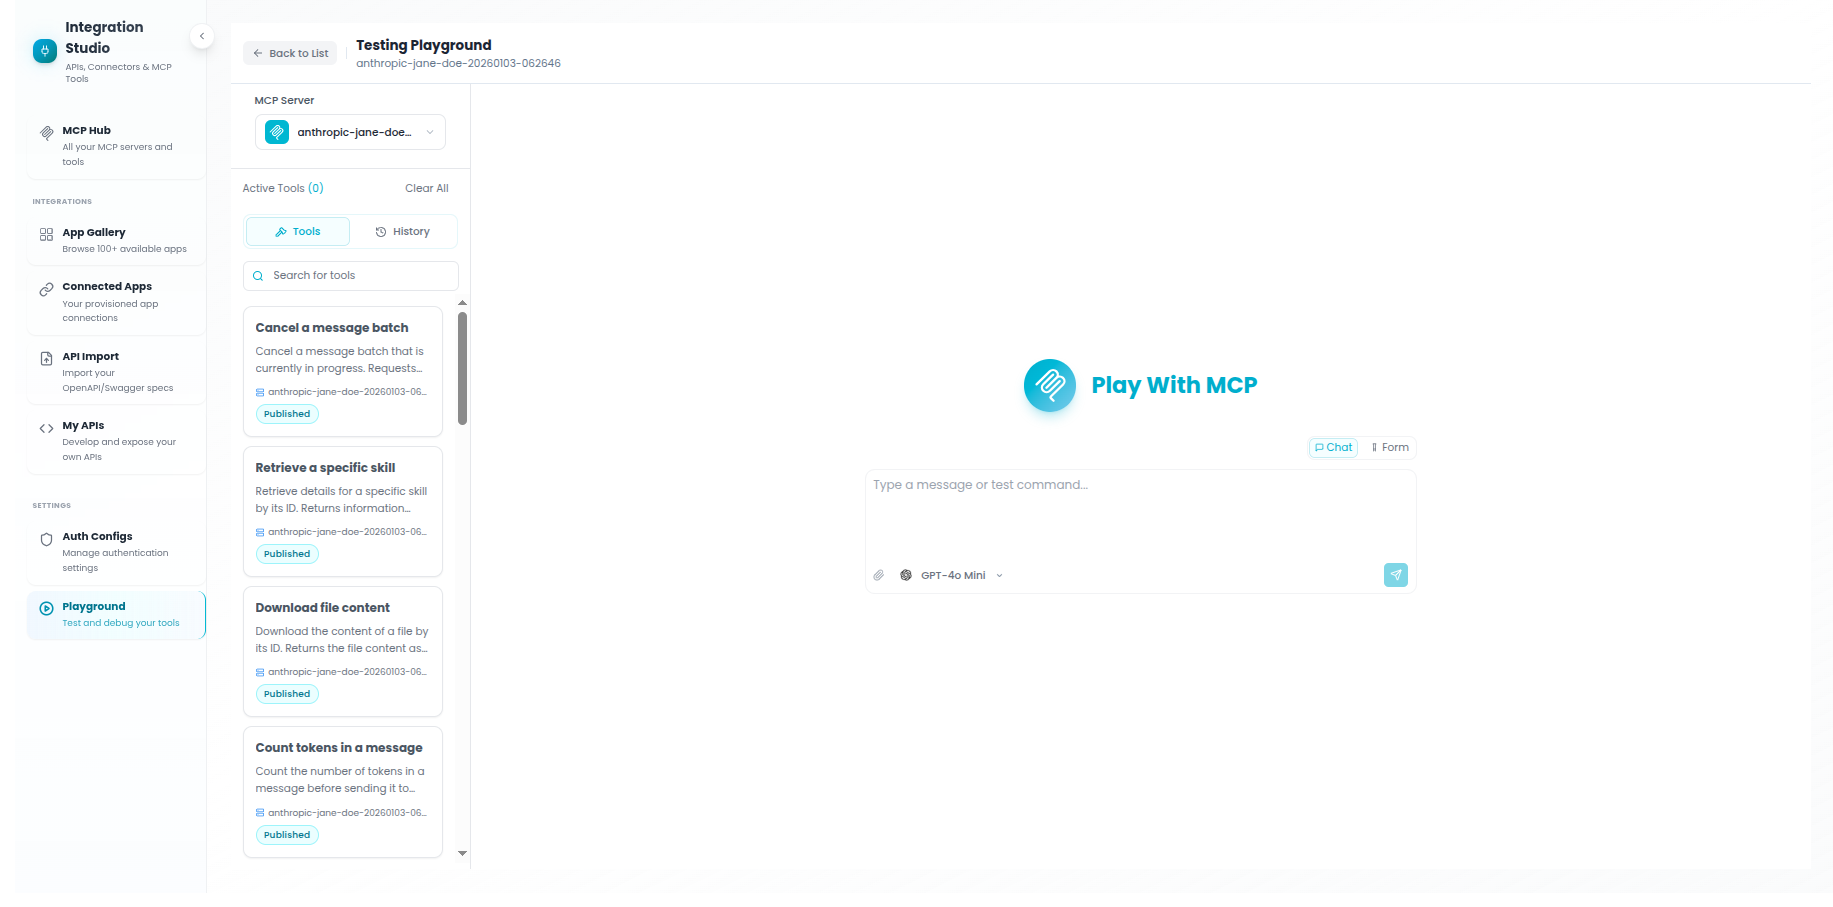
Testing MCP Tools
Individual Tool Testing
Test a single MCP tool with custom parameters:
1
Select MCP Server
2
Choose a Tool
3
Fill Parameters
- Strings, numbers, booleans
- Arrays and objects (JSON format)
- File uploads (for tools that support files)
4
Execute Tool
Multi-Tool Testing
Test multiple tools in sequence or parallel:
Structured Testing Mode
- Enable Structured Tests mode in the settings panel
- Select multiple tools from the sidebar (checkbox selection)
- Configure parameters for each selected tool
- Execute all tools with a single click
- View results side-by-side in the results panel
Chatting with AI Agents
Agent Chat Mode
Interact with AI agents that have access to MCP tools:
1
Switch to Agent Mode
2
Start a Conversation
- "Search for recent orders in the CRM"
- "Get the weather forecast for New York"
- "Analyze the sales data from last month"
3
Watch Agent Reasoning
- Thinking steps - Agent's reasoning process
- Tool calls - Which MCP tools the agent invokes
- Tool results - Data returned from each tool
- Final response - Agent's synthesized answer
4
Review Execution Trace
Agent Sessions
The Playground maintains conversation sessions:
Session Management
- Create New Session - Start fresh conversation with the agent
- Continue Session - Agent remembers previous messages
- Session History - Access previous conversations
- Session Context - View conversation context and memory
Testing Workflows
Workflow Mode
Test entire agentic workflows with inputs and outputs:
1
Select Workflow Mode
2
Configure Input Data
3
Execute Workflow
4
Review Output
Execution Tracing
Real-Time Trace Viewer
The execution drawer shows detailed traces of every operation:
Trace Information
- Step-by-step execution flow
- Timestamp for each operation
- Step duration and performance
- Success/failure indicators
- Tool name and parameters
- Request payload (JSON)
- Response data
- Execution time
- LLM prompts sent
- Agent thinking process
- Tool selection reasoning
- Token usage metrics
- Error messages and stack traces
- Failed step identification
- Retry attempts
- Debugging hints
Streaming Updates
Watch execution in real-time with streaming updates:
Live Execution Streaming
- See each step as it executes (no waiting for completion)
- Monitor agent reasoning in real-time
- Watch tool calls happen live
- Identify performance bottlenecks immediately
Playground Settings
Configuration Options
Available Settings
Best Practices
Testing Best Practices
Debugging Common Issues
Troubleshooting Guide
- Check authentication credentials are configured correctly
- Verify parameter types match tool schema
- Review execution trace for detailed error messages
- Test the tool individually before using in agent
- Ensure MCP server is properly connected to the agent
- Check tool descriptions are clear and relevant
- Verify agent has permission to use the tools
- Try more explicit prompts mentioning tool capabilities
- Check execution trace for slow tools
- Verify MCP server is running and responsive
- Review agent reasoning steps for unnecessary loops
- Consider caching frequently accessed data
- Review tool parameters passed by the agent
- Check if tool output format matches expectations
- Verify agent prompt includes necessary context
- Test tool independently to isolate the issue